 Fundraising Fox
Minnesota State Board of Investment
Institutional investorSt. Paul · 4 people tracked
Find your way into Minnesota State Board of Investment
Sign up to see every warm intro you have to Minnesota State Board of Investment
- Paths you didn't know you had: your email and LinkedIn already hold routes to the Minnesota State Board of Investment team. We find them for you
- 2nd- and 3rd-degree connections: the friend-of-a-friend routes that take hours to manually find through your inbox or LinkedIn
- Answers now, not in days: momentum is everything in a raise. Skip asking around whether someone knows someone
Days of research, done the moment you sign in, with every route ranked by how warm it is.
Investment thesis
The Minnesota State Board of Investment manages investments for Minnesota's state and local employee benefit plans, public retirement savings plans, tax-advantaged savings plans, and non-retirement assets. Its activities are governed by the Prudent Person Rule and standards set out in Minnesota Statutes Chapters 11A and 356A. The Board acts as a fiduciary, with its primary role being to monitor and evaluate investment programs to make sound investment decisions. It delegates execution to an Executive Director, staff, consultants, and investment professionals, supported by advisory committees. A set of Investment Beliefs and an Investment Policy Statement guide the management of the Combined Funds and other programs.
Source: firm website, verified Nov 8, 2026.
Team · 4 people
from the firm's website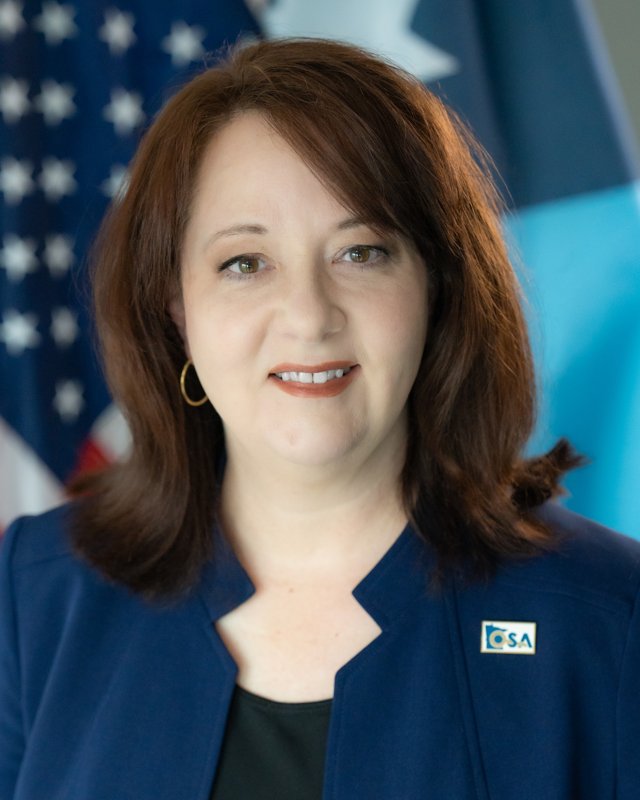
Member of the Minnesota State Board of Investment serving ex officio as Minnesota State Auditor.
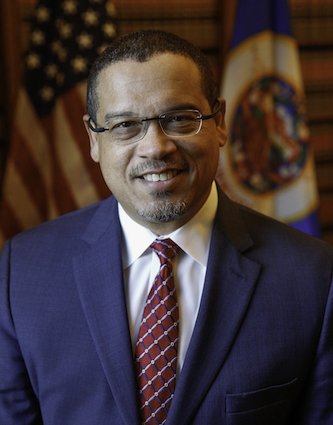
Member of the Minnesota State Board of Investment serving ex officio as Minnesota Attorney General.
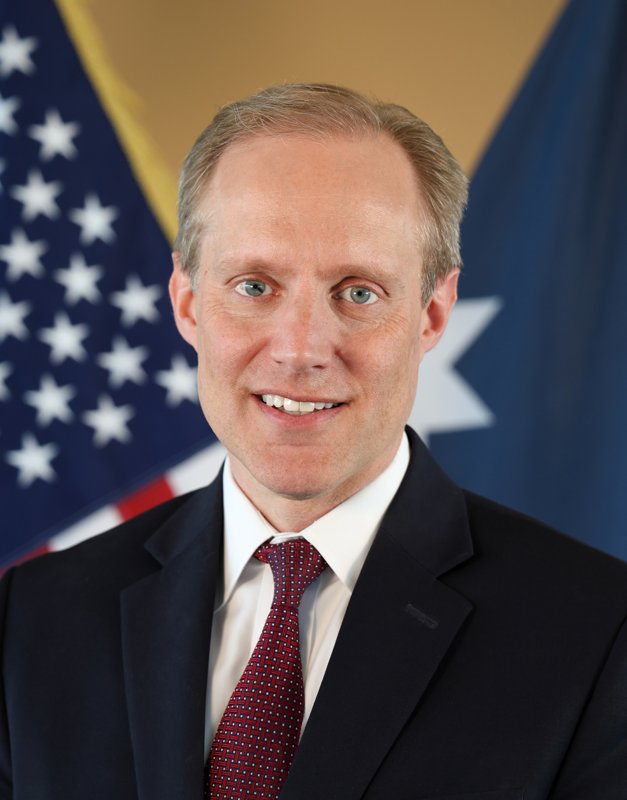
Member of the Minnesota State Board of Investment serving ex officio as Minnesota Secretary of State.
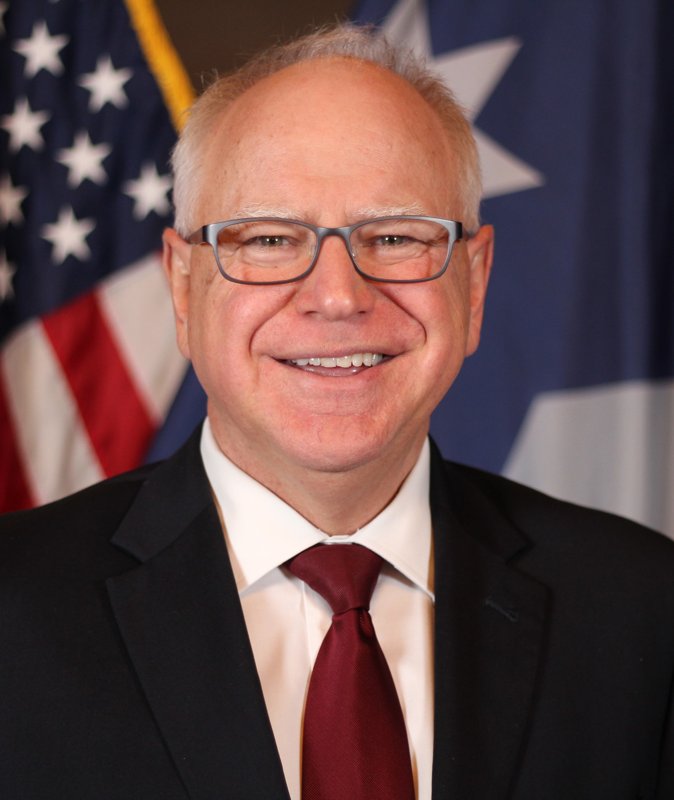
Serves as Chair of the Minnesota State Board of Investment in his capacity as Governor of Minnesota.
Fund commitments · as a limited partner · 368
as of Dec 2025Private-fund positions this organization discloses in its own public filings and reports — $47.5B committed, $23B reported NAV. Returns are this LP's own position, net of fees.
| Fund | Manager | Vintage | Committed | NAV | Net IRR | TVPI | DPI |
|---|---|---|---|---|---|---|---|
| BlackRock Long Term Capital, SCSP | BlackRock | 2019 | $950M | $343.6M | 22.4% | 2.11x | 1.75x |
| Blackstone Supplemental Account - M | The Blackstone Group | 2021 | $425M | $91.1M | -2.9% | 0.93x | 0.04x |
| KKR North America Fund XIV | Kohlberg Kravis Roberts | 2025 | $400M | — | — | — | — |
| Public Pension Capital | Public Pension | 2014 | $375M | $235.3M | 22.9% | 1.95x | 0.99x |
| Blackstone Capital Partners Asia III | The Blackstone Group | — | $300M | — | — | — | — |
| Blackstone Real Estate Partners IX LP | The Blackstone Group | 2019 | $300M | $301.4M | 8.5% | 1.27x | 0.36x |
| Brookfield Strategic Real Estate Partners IV | Brookfield Asset Management | 2022 | $300M | $249.4M | 5.6% | 1.12x | 0.15x |
| Carlyle Realty Partners IX | Carlyle Group | 2021 | $300M | $207.3M | 3.5% | 1.05x | 0.08x |
| KKR North America Fund XIII | Kohlberg Kravis Roberts | 2021 | $300M | $350.4M | 10.0% | 1.22x | 0.02x |
| Lexington Co-Investment Partners V | Lexington Partners | 2020 | $300M | $385.2M | 13.3% | 1.44x | 0.21x |
| Lexington Co-Investment Partners VI | Lexington Partners | 2023 | $300M | $88.5M | 17.7% | 1.07x | 0.00x |
| MN Asia Investors | MN Asia Investors | 2020 | $300M | $191.1M | 5.8% | 1.13x | 0.06x |
| Oaktree Opportunities Fund XI, L.P. | Oaktree | 2020 | $300M | $184M | 9.2% | 1.33x | 0.60x |
| Warburg Pincus Global Growth XIV | Warburg Pincus | 2022 | $300M | $283M | 16.9% | 1.31x | 0.13x |
| Blackstone Capital Partners Asia II, L.P. | The Blackstone Group | 2022 | $270M | $189.2M | 29.2% | 1.51x | 0.22x |
| Adams Street Global Secondary Fund 7 | Adams Street Partners | 2022 | $265.4M | $220.6M | 21.1% | 1.48x | 0.25x |
| CVC Capital Partners VI, L.P. | CVC Capital Partners | 2014 | $264.3M | $175M | 15.3% | 2.04x | 1.46x |
| Blackstone Growth | The Blackstone Group | 2020 | $250M | $227.7M | -0.5% | 0.98x | 0.13x |
| Blue Owl GP Stakes IV | Blue Owl Capital | 2018 | $250M | $187M | 32.8% | 2.02x | 1.19x |
| Brookfield Capital Partners V,L.P. | Brookfield Asset Management | 2019 | $250M | $342.3M | 13.5% | 1.65x | 0.40x |
| Dyal Capital Partners IV | Dyal Capital Partners | 2018 | $250M | $200.7M | 41.5% | 1.83x | 0.71x |
| Energy Capital Partners VI | Energy Capital Ventures | — | $250M | — | — | — | — |
| Hellman & Friedman Capital Partners X, L.P. | Hellman & Friedman | 2021 | $250M | $256.9M | 5.5% | 1.16x | 0.15x |
| Permira IX | Permira | — | $250M | — | — | — | — |
| Summit Partners Growth Equity Fund XI, L.P. | Summit Partners | 2021 | $250M | $153.6M | 4.6% | 1.08x | 0.02x |
| Summit Partners Growth Equity XII | Summit Partners | — | $250M | — | — | — | — |
| Warburg Pincus Global Growth | Warburg Pincus | 2019 | $250M | $275.4M | 13.4% | 1.75x | 0.59x |
| Welsh, Carson, Anderson & Stowe XIII | Welsh, Carson, Anderson & Stowe | 2019 | $250M | $252.5M | 17.8% | 1.64x | 0.63x |
| Apax VIII USD | Apax | 2012 | $200M | $9.6M | 12.5% | 1.56x | 1.52x |
| Blackstone Energy Transition Partners IV L.P. | The Blackstone Group | 2024 | $200M | $118M | 51.6% | 1.17x | 0.01x |
| Blackstone Real Estate Partners X L.P. | The Blackstone Group | 2022 | $200M | $88.2M | 7.2% | 1.09x | 0.12x |
| Blue Owl GP Stakes V | Blue Owl Capital | 2020 | $200M | $91M | 9.7% | 1.20x | 0.43x |
| Brookfield Real Estate Finance Fund VI | Brookfield Asset Management | 2021 | $200M | $61.3M | 7.2% | 1.11x | 0.67x |
| CVI Global Value Fund, L.P. | CarVal Investors | 2007 | $200M | — | 9.5% | 1.69x | 1.69x |
| Dyal Capital Partners V | Dyal Capital Partners | 2020 | $200M | $40.5M | 18.2% | 1.28x | 0.58x |
| EIG Energy Fund XVI | EIG Global Energy Partners | 2013 | $200M | $70.4M | 2.3% | 1.12x | 0.77x |
| Energy Capital Partners III | Energy | 2013 | $200M | $83.1M | 13.2% | 1.73x | 1.39x |
| First Reserve Fund XIII, L.P. | First Reserve Corporation | 2014 | $200M | $75.8M | -2.1% | 0.91x | 0.60x |
| Green Equity Investors VI | Green | 2011 | $200M | $83.1M | 12.7% | 1.87x | 1.57x |
| KKR 2006 Fund, L.P. | Kohlberg Kravis Roberts | 2006 | $200M | $62.6K | 9.1% | 1.80x | 1.80x |
| KKR Global Infrastructure Investors V | Kohlberg Kravis Roberts | 2024 | $200M | $49.9M | — | 1.02x | 0.03x |
| KKR Millennium Fund, L.P. | Kohlberg Kravis Roberts | 2002 | $200M | — | 16.4% | 2.07x | 2.07x |
| Lexington Capital Partners VII LP | Lexington Partners | 2009 | $200M | $3.7M | 14.1% | 1.65x | 1.63x |
| Lexington Co-Investment Partners IV | Lexington Partners | 2017 | $200M | $181.4M | 14.8% | 1.88x | 1.06x |
| Marathon Distressed Credit Fund | Marathon | 2020 | $200M | $94.4M | 10.1% | 1.38x | 0.80x |
| Marathon Distressed Credit Fund II | Marathon | 2023 | $200M | $157.2M | 11.8% | 1.11x | 0.12x |
| Oaktree Real Estate Debt III | Oaktree | 2020 | $200M | $134.2M | 3.7% | 1.10x | 0.27x |
| Oaktree Real Estate Opportunities Fund VIII | Oaktree | 2020 | $200M | $128.4M | -0.2% | 1.00x | 0.28x |
| Oaktree Special Situations Fund III | Oaktree | 2022 | $200M | $89.3M | 24.7% | 1.36x | 0.38x |
| Realty Associates Fund XIV | Realty Associates | — | $200M | — | — | — | — |
| Stellex Capital Partners III | Stellex Capital Management | 2024 | $200M | $49.1M | -17.1% | 0.89x | 0.06x |
| The Energy & Minerals Group Fund III LP | The Energy & Minerals Group | 2014 | $200M | $74.1M | -6.5% | 0.57x | 0.22x |
| Varde Fund XI, L.P. | The Varde | 2014 | $200M | $25.9M | 4.3% | 1.32x | 1.19x |
| Vista Equity Partners Perennial | Avista | 2020 | $200M | $276.8M | 10.5% | 1.50x | 0.12x |
| Warburg Pincus Private Equity Fund XI, L.P. | Warburg Pincus | 2009 | $200M | $43.3M | 11.4% | 1.73x | 1.51x |
| KKR Lending Partners III L.P. | Kohlberg Kravis Roberts | 2017 | $199M | $48.5M | 12.4% | 1.26x | 1.09x |
| Bridgepoint Europe VI, L.P. | Bridgepoint | 2018 | $176.2M | $170.6M | 16.4% | 1.87x | 0.82x |
| Bridgepoint Europe VIII | Bridgepoint | — | $176.2M | — | — | — | — |
| IK Fund VII | IK Small Cap | 2013 | $176.2M | $167.5K | 13.9% | 1.84x | 1.84x |
| IK Fund VIII | IK Small Cap | 2016 | $176.2M | $49.4M | 16.7% | 1.83x | 1.56x |
| Nordic Capital Fund VIII, L.P. | Nordic Capital | 2013 | $176.2M | $66.1M | 12.4% | 1.61x | 1.32x |
| Nordic Capital IX Beta, L.P. | Nordic Capital | 2017 | $176.2M | $231.2M | 15.0% | 1.79x | 0.60x |
| Permira V LP | Permira | 2014 | $176.2M | $41.4M | 20.4% | 2.75x | 2.53x |
| Permira VIII | Permira | 2022 | $176.2M | $119.2M | 13.6% | 1.23x | 0.02x |
| Blue Owl GP Stakes III | Blue Owl Capital | 2015 | $175M | $180.7M | 23.9% | 1.98x | 1.19x |
| Court Square Capital Partners III | Court Square Capital Partners | 2012 | $175M | $86.9M | 20.4% | 2.44x | 1.99x |
| Dyal Capital Partners III | Dyal Capital Partners | 2015 | $175M | $168.4M | 26.0% | 1.79x | 1.00x |
| Hellman & Friedman Capital Partners VI LP | Hellman & Friedman | 2007 | $175M | $3.2M | 12.9% | 1.86x | 1.84x |
| Hellman & Friedman Investors IX, L.P. | Hellman & Friedman | 2018 | $175M | $291.9M | 13.4% | 1.77x | 0.21x |
| Wind Point Partners XI | Wind Point Partners | — | $175M | — | — | — | — |
| Windjammer Capital Fund VI | Windjammer Capital | 2023 | $175M | $16.4M | -18.5% | 0.75x | 0.00x |
| Merit Energy Partners I, L.P. | Merit Energy Company | 2014 | $169.7M | $93M | 6.1% | 1.46x | 0.92x |
| Court Square Capital Partners II | Court Square Capital Partners | 2006 | $164.4M | $150.6K | 12.3% | 1.76x | 1.75x |
| Nordic Capital Fund XII | Nordic Capital | — | $164.3M | — | — | — | — |
| IK Fund IX | IK Small Cap | 2019 | $158.6M | $191.4M | 7.5% | 1.31x | 0.02x |
| Nordic Capital Fund X, L.P. | Nordic Capital | 2021 | $158.6M | $173.6M | 14.2% | 1.50x | 0.20x |
| Permira VII L.P.1 | Permira | 2019 | $158.6M | $184.9M | 8.1% | 1.39x | 0.17x |
| Permira VII LP 1 | Permira | — | $158.5M | $178.2M | 8.1% | 1.34x | 0.17x |
| Advent International GPE X | Advent International | 2022 | $150M | $123.9M | 16.5% | 1.34x | 0.02x |
| Advent International GPE XI SCSp | Advent International | — | $150M | — | — | — | — |
| AG Realty Fund X, L.P. | TPG | 2018 | $150M | $78.8M | 8.3% | 1.28x | 0.70x |
| Apax IX USD, L.P. | Apax | 2016 | $150M | $68.8M | 17.2% | 1.89x | 1.47x |
| Apax X USD | Apax | 2019 | $150M | $159.6M | 9.1% | 1.32x | 0.27x |
| Audax Mezzanine Fund V | Audax Group | 2020 | $150M | $71.7M | 11.9% | 1.18x | 0.37x |
| Blackstone Capital Partners IX | The Blackstone Group | 2022 | $150M | $11.8M | 29.4% | 1.27x | 0.00x |
| Blackstone Capital Partners VIII LP | The Blackstone Group | 2021 | $150M | $147.6M | 8.4% | 1.25x | 0.26x |
| Blackstone Growth Equity II | The Blackstone Group | 2022 | $150M | — | — | — | — |
| Blackstone Real Estate VIII, L.P. | The Blackstone Group | 2015 | $150M | $113.5M | 15.3% | 1.67x | 1.02x |
| Blackstone Real Estate VIII.TE.1 L.P. | The Blackstone Group | 2015 | $150M | $82.8M | 11.6% | 1.52x | 1.08x |
| Blue Owl GP Stakes VI | Blue Owl Capital | 2024 | $150M | $3M | — | 0.40x | 0.00x |
| Brookfield Capital Partners Fund VI | Brookfield Asset Management | 2022 | $150M | $119.3M | 13.1% | 1.26x | 0.05x |
| Carlyle Partners VII LP | Carlyle Group | 2018 | $150M | $163.4M | 7.7% | 1.36x | 0.35x |
| Carlyle Partners VIII, L.P. | Carlyle Group | 2022 | $150M | $111.9M | 8.6% | 1.16x | 0.20x |
| Carlyle Realty Partners VIII, L.P. | Carlyle Group | 2017 | $150M | $44.7M | 17.4% | 1.40x | 1.07x |
| Court Square Capital Partners IV, L.P. | Court Square Capital Partners | 2018 | $150M | $153.3M | 17.3% | 1.60x | 0.72x |
| CVI Credit Value Fund A II | CVI | 2012 | $150M | $1M | 8.3% | 1.43x | 1.42x |
| CVI Credit Value Fund A III | CVI | 2015 | $150M | $6.5M | 8.4% | 1.39x | 1.34x |
| CVI Credit Value Fund IV | CVI | 2017 | $150M | $56.6M | 7.8% | 1.61x | 1.07x |
| CVI Credit Value Fund V | CVI | 2020 | $150M | $114.2M | 8.3% | 1.26x | 0.46x |
| EIG Energy Fund XV | EIG Global Energy Partners | 2010 | $150M | $2.2M | 1.1% | 1.05x | 1.03x |
Largest 100 of 368 disclosed positions. Source: Minnesota SBI Private Markets - 4Q_2025_Private_Markets. TVPI = total value / paid-in; DPI = distributions / paid-in.
Frequently asked questions
- Where is Minnesota State Board of Investment located?
- Minnesota State Board of Investment is headquartered in St. Paul, US.